 I got this from a Google search on 10/11/15.
The LHC and me:
The Large Hadron Collider, or LHC is an enormous particle accelerator in Europe. At its heart of a 17 mile long circle around which large particles are accelerated to great speed and then smashed into other particles. I encourage you to read more in the relevant Wikipedia article. Its success in confirming the Higgs boson (at a price tag of some $13 billion) is one of the few things so far that have happened this century that can be considered an improvement over the last century. The only other thing I can think of is the Minions.
At all events I was puttering around my lab and had reason to think of the LHC. I’ll not go into the experimental design; traditionally it’s considered rude for a scientist to release information about ongoing work. That’s a pity, but there it is. I take such an extreme departure from what is publicly acknowledged by scientists, with the exception of Professor Robin Fox in his chapter, “Marry in or Die Out” in the textbook Handbook on Evolution and Society, that it seem idle not to conform to standard practice wherever possible. But I think it’s fair to offer the following.
In the part of my work in question, I am running an experimental population against a control population. The control has just spat out, so to speak, the number 1,770 (rounding up to the nearest 10). My work generally is bedeviled by low numbers. Well the numbers aren’t so low, but the noise level is so great that information has to be accumulated for a long time to see the pattern though the noise. On this occasion, however, the experimental value was 560. I trust you agree that 560 is lower than 1,700.
But we can do better. The Higgs boson was “observed,” which is to say after the measurements were made by the mechanism including the ring, sensors, a power supply, an ion source, vacuum pumps, and a host other things, many of which I have neither heard of nor would understand if I did hear, and those measurements were extensively digested by computers, there was implied a hitherto expected but unobserved particle of energy between 125 billion electron volts and 127 billion electron volts. And the confidence that this observed number was simply noise was that there was only a single change out of a million that it was a fluke. Well, two teams were working independently and simultaneously and both got the same result.
They also reported that the chance of a fluke was 0.0000005 out of 1. So they are making an approximation somewhere. Not to worry, they seem to have chosen and achieved a target of 5 Σ. Now I’m sure that among those how have waded through the previous paragraph there are two kinds of reactions: some will heave a sigh of relief and say, “Ah, at last you are making sense,” while others will shriek, “I was all right until you started throwing in something in Greek without defining it; is that a college fraternity?”
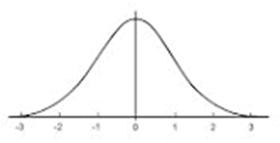
The funny letter means “standard deviation.” There is something called the “normal curve.”
I got this from a Google search on 10/11/15.
If you have a number of measurements, and if your data set follows the “normal” distribution, then a certain portion of your measurements should lie within the span -1 to +1 standard deviations. More will lie between -2 and +2. Similarly, a certain fraction will lie outside -1 to +1 and a smaller fraction outside -2 to +2. And there is a table that will give you how many lie within any number of standard deviations you might choose:
Within 1 sigma 68%
Within 2 sigma 96%%
Within 3 sigma 99.8%
The table goes on. By the time you get to 5 standard deviations your plus or minus 5 sigma will include just about all but 1 in 1 million of your measurement.
Of course things can be more complicated. Your own data might have a curve that is pointier or flatter, might lean to the left or right or might turn out actually to be two populations. For instance, if you are measuring the muscular strength of people in a hospital, you’ll find that the staff cluster around one average strength, and the patients will cluster around a different average. Putting the curve together makes a mess of it all.
By now it seems fair to demand, “Well where am I supposed to get my own curve from? Do I have to figure out how to draw the proper curve? That’s a good question, and here’s the secret. I have taken a number of statistics courses, and this point they never seem to make, or at least they fail to emphasize it.
In a set of measurements that follow a classical normal distribution, the standard deviation is the square root of the mean, the average.
At least that’s the way I sort it out. If anybody has a different opinion, do let me know. So let’s say you have a bunch of measurements that average 16. Somebody comes along and says, “Hey, measure this. Is it like those you already have?” Well the square root of 16 is four. So plus or minus one standard deviation is anywhere from 12 to 20. So you measure the guy’s whatever and it comes out anywhere in that range, and you say, “Yep, it’s just like all the others, at least as far as this measurement goes.”
So he goes off and comes back for another for you to measure. Is it from the same population? It measures 9. You say, “I’d expect it’s the same. It’s within 2 standard deviations. 5% are going to be outside even 2 standard deviations.” But if it measures 7, you say, “Probably different. There’s less than a 5% chance that something like what I have will measure that far from the average. 3 sigma, which is between 4 an 29, and more than 99% of measurements of things in your population. If it’s outside that, you can say, “It’s really not likely to be one of my population; see if you can figure out why it’s different. And out at 5 sigma, you say, “There’s only one in a million of my population that would be out there.”
So success at “proving” the Higgs boson was pegged at 5 sigma. Of course they could have gone collecting data, but they’d already spent a lot of money and the chance that there was nothing there after all was vanishingly small.
So let’s look at my numbers:
My control came out at 1,770. Assume that this is correct and is sort of divinely ordained that under the exact circumstance of my measurement, when you repeat it again and again, the average will always come out to be that. The square root of 1,770 is about 42. The experimental measurement was 560, which is 1,210 away from our assumed mean. Divide by 42, any you get 28 standard deviations. Sure, my single control measurement might be off by three or four standard deviation; let’s say it’s off by 5 standard deviations and the “true ordained mean (average of course) is 5 standard deviations lower. We’re still 23 standard deviations from the mean. The chance of that is laughable. The web site I looked up for the table doesn’t even go above 3 standard deviations. For a scientific paper, the debate is over whether you can publish a paper where your results are a 2 standard deviation difference between experiment and control or should you go on to 3? In going for 5 sigma, the folks at the LHC were playing to the grandstands. I have read, in a renowned journal a paper in which the result was only one standard deviation from the control.
And here I sit with a result that is of monumental importance where my experimental result is 28 sigma.
Insult my looks, belittle my mind, curse my family, denigrate my political opinions, scorn my education (As father Damian said, “Harvard, Johns Hopkins, places like that.”), vandalize my property and there are people who will approve. But don’t go up against the statistical significance of my experiment.
And I’m still amassing data, lots of data.
There have been 147 visitors over the past month and YouTube has run “Babies Triumph over Evil” 154 times.